Analyzing Metrics and Creating Alerts Using Prometheus and Grafana
Prometheus is an open-source API monitoring system that allows you to gather data and analyze a variety of key API performance metrics. For a complete list of the metrics provided by Thriftly, please see Thriftly Metrics.
Additionally, you can use Prometheus’s integration with Grafana to create comprehensive metrics dashboards and automatically alert you if your API’s performance hits a certain threshold. For example, you could create an email alert designed to notify you when your API is overtaxed (receiving too many calls or responding to requests too slowly).
By connecting your Thriftly API with Prometheus and Grafana, you can monitor your API’s performance, determine whether it’s meeting your performance goals, and receive automatic notification of any irregularities.
In this topic, we’ll walk you through:
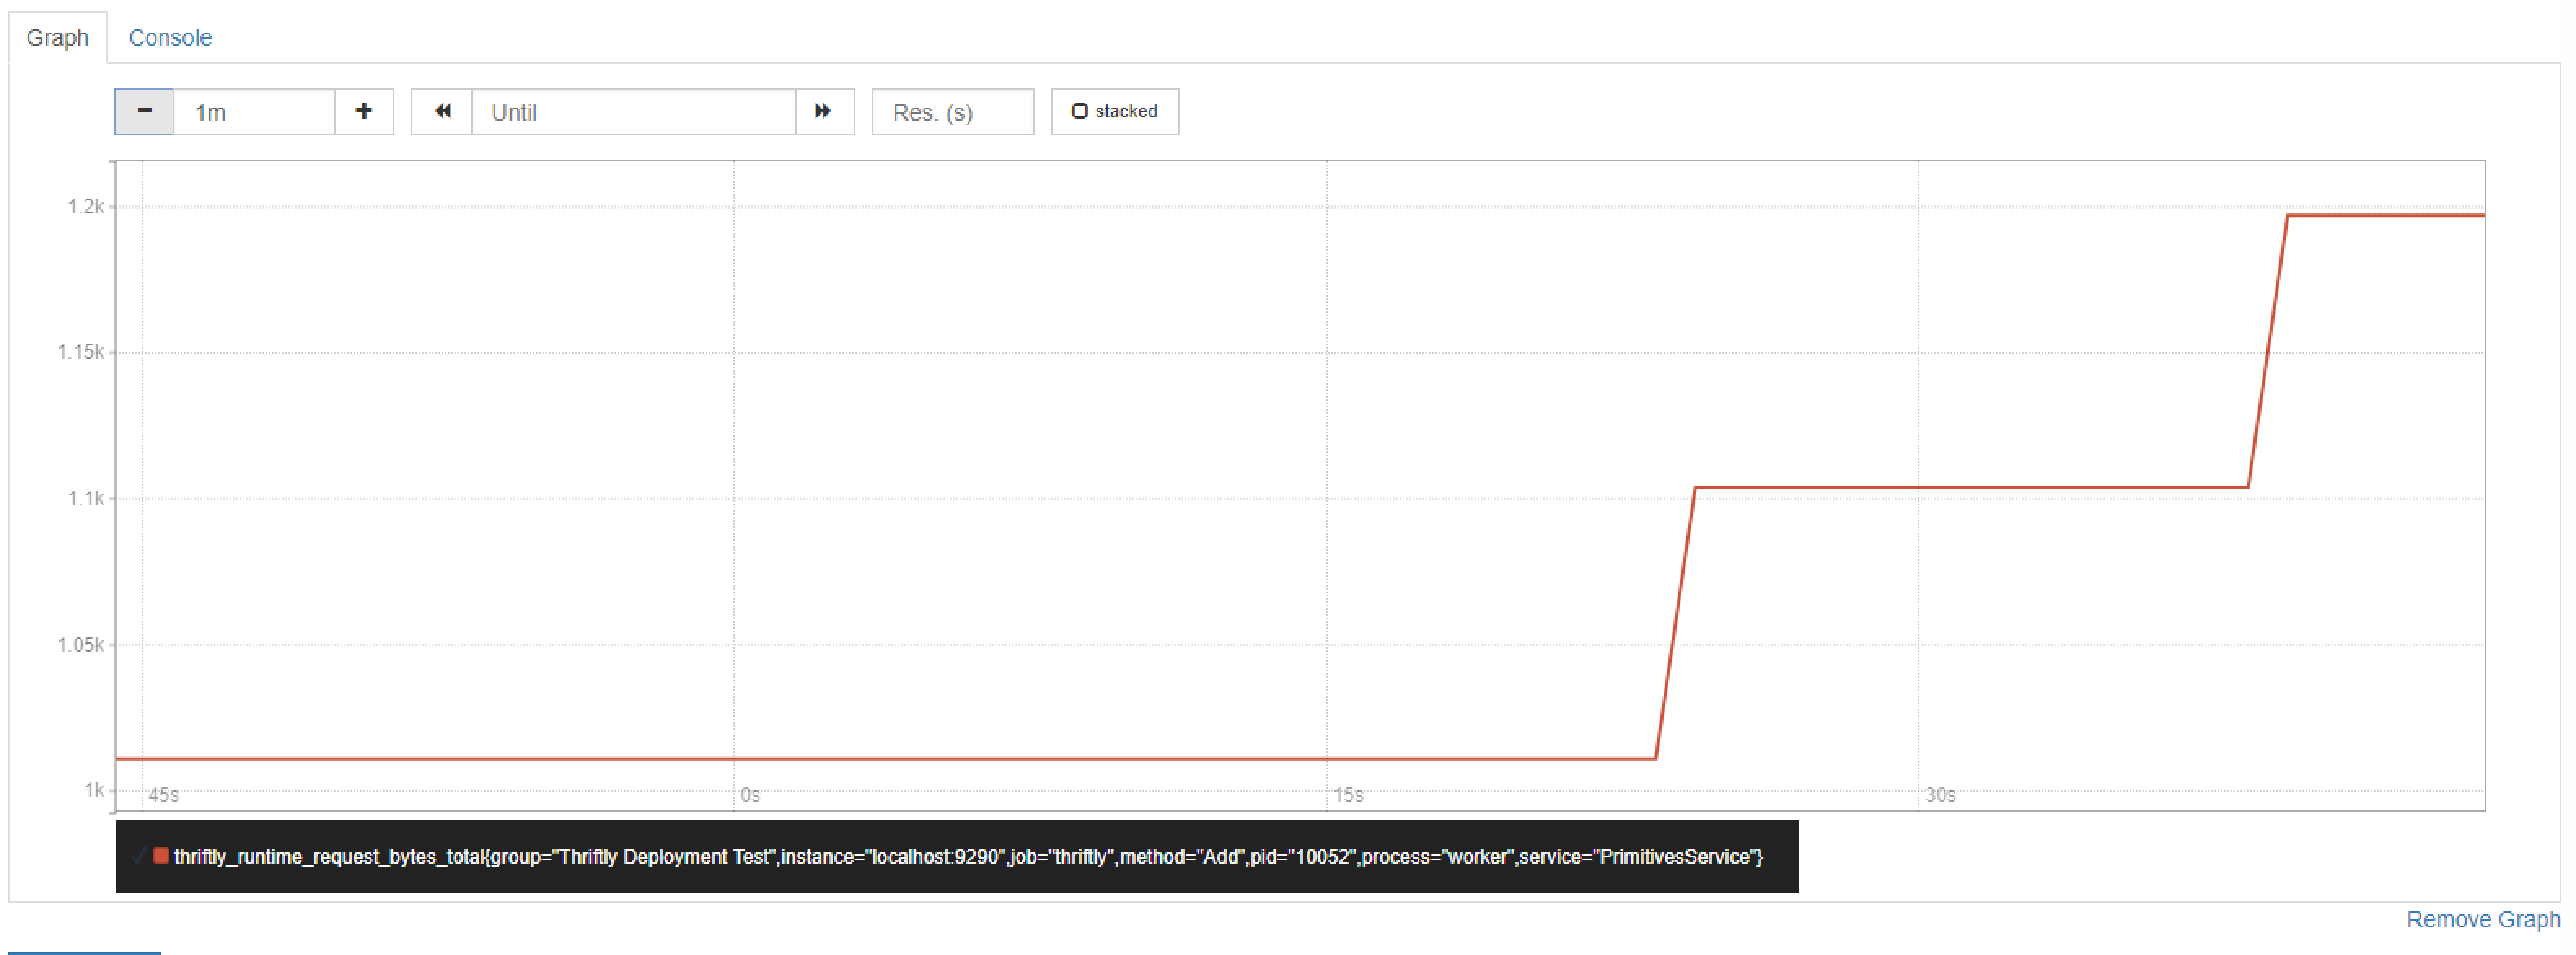
Installing Prometheus and tracking some basic metrics, as described in the Analyzing Metrics Using Prometheus section.
Connecting Prometheus to Grafana to:
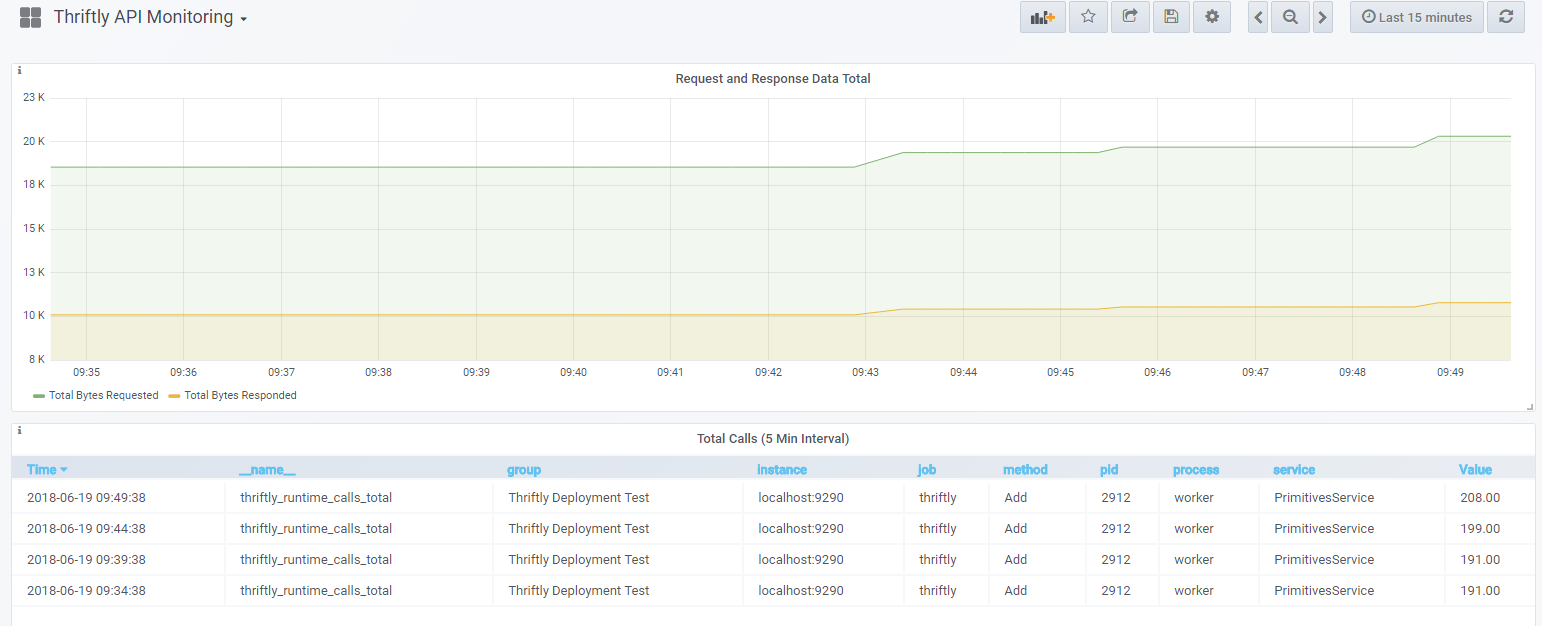
Create metrics dashboards, as described in the Creating Metrics Dashboards in Grafana section.
Fire email alerts, as described in the Creating Grafana Email Alerts section.