Logging Troubleshooting Information Using the Trace Utility
As you test your API and its performance, you can use our Trace Utility to log application events, errors, potentially harmful situations, and other occurrences. This log can aid you (or us) in performing any necessary troubleshooting.
To log this troubleshooting information, you must enable the Trace Utility and then access the Windows Debug Output, using a program such as DebugView. After you’ve finished performing your testing, it’s very important that you disable the Trace Utility, so the utility does not affect your application and APIs’ performance.
To enable the Trace Utility:
From the Windows Start menu, select Thriftly Deployment Server > Trace.Control. After you enable the utility, it appears in the Windows System Tray.
From the System Tray, open the Mertech Driver Trace Utility. The Mertech Trace Utility window appears.
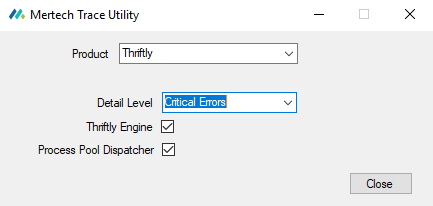
From the Trace Utility window, you can control the level of detail at which the Trace Utility logs events. In the Detail Level field, you can configure the Trace Utility to show messages from the following categories. Note that, whichever category you select, the Trace Utility shows messages from that category and higher. So if, for example, you select Warnings, the Trace Utility shows messages from the Warnings, Errors, and Critical Errors categories:
Internal Messages: Selecting this level shows internal messages.
Debug Messages: Selecting this level shows low-level application events.
Informational Messages: Selecting this level shows messages that highlight high-level application progress.
Warnings: Selecting this level shows messages about potentially harmful situations.
Errors: Selecting this level shows messages about error events that might allow the application to continue running.
Critical Errors: Selecting this level shows messages about severe errors that will likely cause your application to crash.
Off: Selecting this level turns off tracing.
To log request and response events, keep the Thriftly Engine checkbox selected.
To log Thriftly Server connection events, keep the Process Pool Dispatcher checkbox selected.
After you’ve defined your Trace Utility settings, you can perform your testing and view tracing information in DebugView (or your debugging application of choice). To do so:
Install DebugView or another debugging application, if you haven’t already.
Run your debugging application as an administrator.
Configure your debugging application to capture Global Win32. In DebugView, you do this by selecting Capture > Capture Global Win32 from the DebugView toolbar.
Begin testing your API(s).
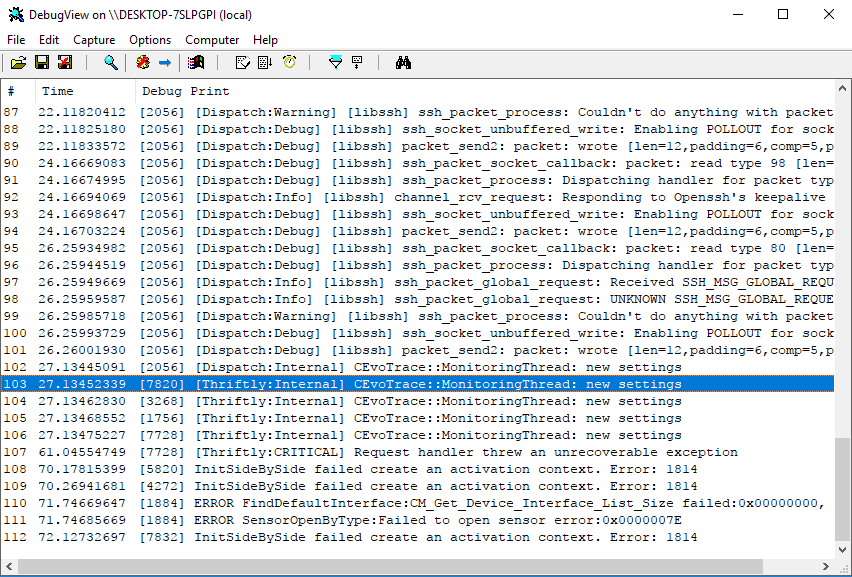
Depending on the level of detail you set in the Trace Utility window, various pieces of information, such as requests received and your connection status, will begin appearing in DebugView. You can use this information to track the time between requests and responses and monitor your Thriftly Server connection, among other things.

Again, after you’ve performed your testing, it’s very important that you disable the Trace Utility, so that tracing does not affect your application and APIs’ performance. To do so:
Open the Windows System Tray and right-click the Mertech Driver Trace Utility icon.
Select Quit to disable the Trace Utility.