Creating Grafana Email Alerts
After you’ve created your Grafana dashboard (as described in the Creating Metrics Dashboards in Grafana topic), you can add metric-based rules designed to alert you if your API’s performance hits a certain threshold.
For example, if you want to receive a notification when your API sends or receives a certain amount of data, or when there’s a large lag time between requests and responses, you can configure Grafana to assess that metric and send you an email in the event your API hits the defined threshold.
To do so, you must:
Create a Grafana alert channel to specify where your alerts should be sent.
Add an alert rule to the dashboard element you want to use to track an API metric.
Creating an Alert Channel
To create an alert channel, you must first configure some email related settings in your Grafana custom.ini file:
Navigate to your Grafana conf folder (by going to the folder in which you placed your Grafana installation and following the path
grafana-version.number.windows-x64\grafana-version.number\conf).Open custom.ini.
Use CTRL + F to find the smtp section of custom.ini.

Configure the smtp section of your custom.ini file as follows:
Uncomment the enabled line (by removing the semicolon at the beginning of the line) and enter enabled = true.
Uncomment the host line and enter host = smtp.youremailprovider:portnumber. For example, if your email provider is Gmail, enter host = smtp.gmail.com:587.
Uncomment the user line and enter user = youremail@youremailprovider.com. For example, if your email is test@gmail.com, enter user = test@gmail.com.
Uncomment the password line and enter password = youremailpassword. For example, if the password for the email account you entered in step c is 12345, enter password = 12345.
Uncomment the skip_verify line and enter skip_verify = true.
Uncomment the from_address line and enter from_address = youremail@youremailprovider.com.
Uncomment the from_name line and enter from_name = Grafana.
Then, you’ll use these email settings to create a notification channel within Grafana itself:
From the Grafana sidebar, select Alerting > Notification channels.
From the Alerting screen, select New Channel.
Configure your channel as follows:
In the Name field, enter a name such as Grafana Dashboard Alerts.
In the type field, enter Email.
In the Email addresses field, enter the email to which you want to send alerts.
Select the Save button to save this alert channel. Then, select the Send Test button to send yourself a test alert. You should receive confirmation that the test was sent successfully.
Now, let’s plug your alert channel into an actual alerting rule, created within one of your dashboard elements, to configure an email alert.
Creating Alert Rules
Navigate back to your metric dashboard (by selecting Dashboards > Manage from the Grafana sidebar and then selecting your dashboard).
Select the title of the element for which you’d like to configure an email alert. In this example, we’re going to use the Request and Response Data Total element we created for our example dashboard. Then, select Edit.
Go to the Alert tab. Select Create Alert.
Fill out the following fields in the Alert Config section:
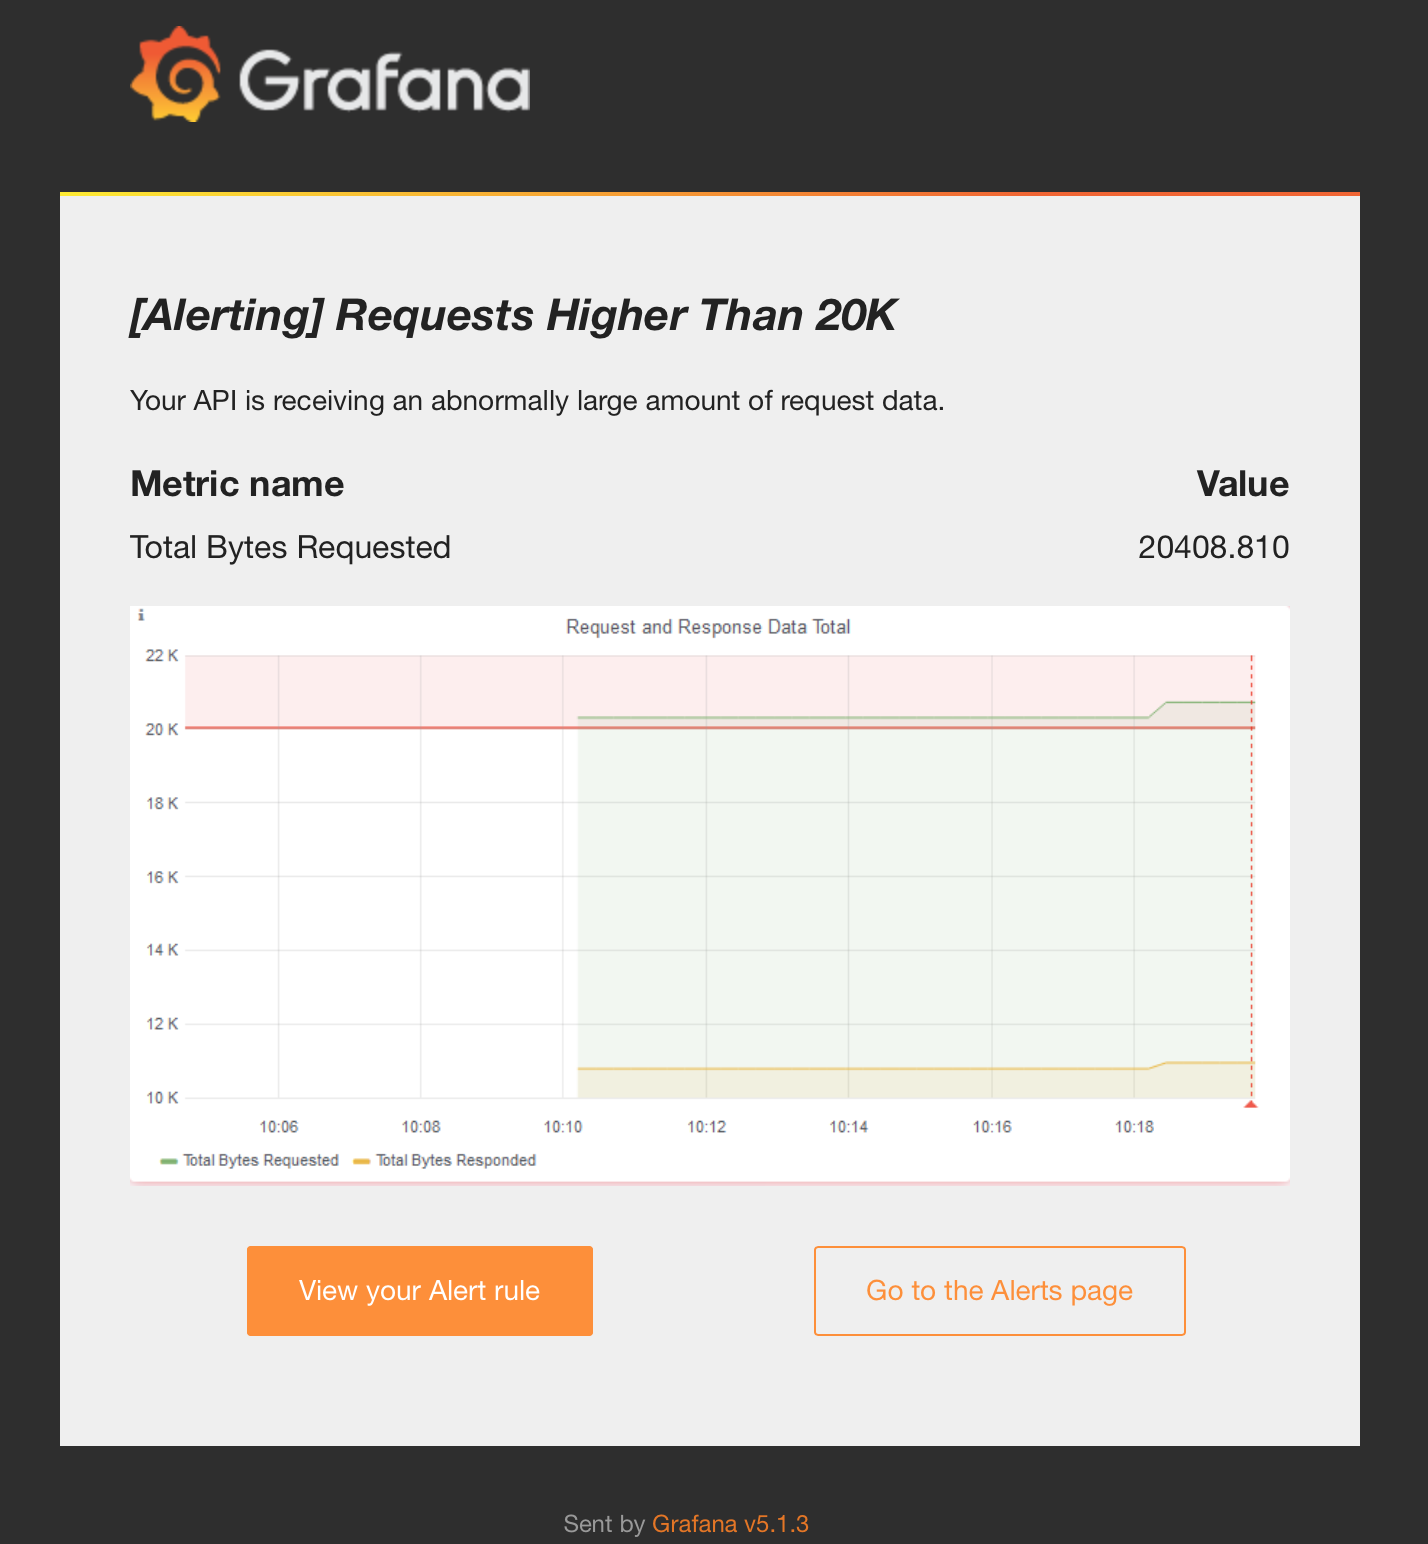
In the Name field, enter a name for this alert. We’re going to create an alert that evaluates the amount of request data our API has received, so we’ll name our alert Requests Higher Than 20K.
In the Evaluate every field, enter the time period at which you want Grafana to re-evaluate this rule and send you an alert if its conditions are met.
In the Conditions section, enter the conditions to be met for your rule to evaluate to True and your alert to be sent. For our example, we’ll enter “WHEN count () of query (A, 5m, now) IS ABOVE 20000” to create a rule that sends us an alert when our API has received more than 20,000 bytes of data. For a more in-depth examination of the rules you can create, refer to Grafana’s own rules documentation.
Select Notifications from the Alert form’s left-hand sidebar. Then, fill out the following fields:
In the Send to field, select the alert channel you created above.
In the Message field, enter the message you want to include in your alert. For example, for our alert, we could enter a message like “Your API is receiving an abnormally large amount of request data.”
And that’s it; you’ve configured your email alert. At this point, we highly recommend testing the workflow that should trigger your rule and fire an alert, to confirm you receive an alert as expected. If you don’t, you might have to reconfigure your rule.
Also, we highly recommend you review Grafana’s own documentation on alert rules and the alerting engine, to learn more about what sorts of rules and workflows you can configure using Grafana.