Analyzing Metrics Using Prometheus
To analyze Thriftly API metrics data in Prometheus, you must:
Install and configure Prometheus.
Launch Prometheus and perform metrics queries.
We’ll walk you through both these steps below.
Installing and Configuring Prometheus
Thriftly works with Prometheus version 1.8. To install and configure this version:
Click the following link to download Prometheus for Windows: prometheus.io. We recommend any stable Prometheus version 2.5 or above.
From your Downloads folder, extract the .tar file contained within the downloaded .tar.gz file. Then, extract the folder contained within the .tar file.
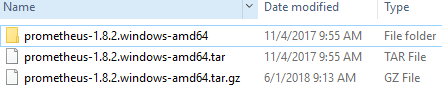
Select and open the prometheus-1.8.2.windows-amd64 folder. Then, using your text editor of choice (we recommend Notepad++), open the prometheus.yml file.
At the end of the prometheus.yml file, add the following text to the scrape_configs section to connect Prometheus to Thriftly:
# my global config
global:
  scrape_interval:     15s # Set the scrape interval to every 15 seconds. Default is every 1 minute.
  evaluation_interval: 15s # Evaluate rules every 15 seconds. The default is every 1 minute.
  # scrape_timeout is set to the global default (10s).

# Alertmanager configuration
alerting:
  alertmanagers:
  - static_configs:
    - targets:
      # - alertmanager:9093

# Load rules once and periodically evaluate them according to the global 'evaluation_interval'. rule_files:
  # - "first_rules.yml"
  # - "second_rules.yml"

# A scrape configuration containing exactly one endpoint to scrape:
# Here it's Prometheus itself.
scrape_configs:
  # The job name is added as a label `job=<job_name>` to any timeseries scraped from this config.
  - job_name: 'prometheus'

    # metrics_path defaults to '/metrics'
    # scheme defaults to 'http'.

    static_configs:
    - targets: ['localhost:9090']
      labels:
        group: 'Prometheus Server'

    - targets: ['localhost:9290']
      labels:
        group: Thriftly Deployment
Save and close prometheus.yml.
You’ve now installed Prometheus and configured it to collect data from your Thriftly APIs. In the next section, we’ll launch Prometheus and review some basic metrics.
Gathering Data and Analyzing Metrics in Prometheus
Let’s launch Prometheus, perform some test calls to your Thriftly API, and view some related performance data in Prometheus.
From the prometheus-1.8.2.windows-amd64 folder, select and launch the prometheus application file. A window like the one pictured below should appear.
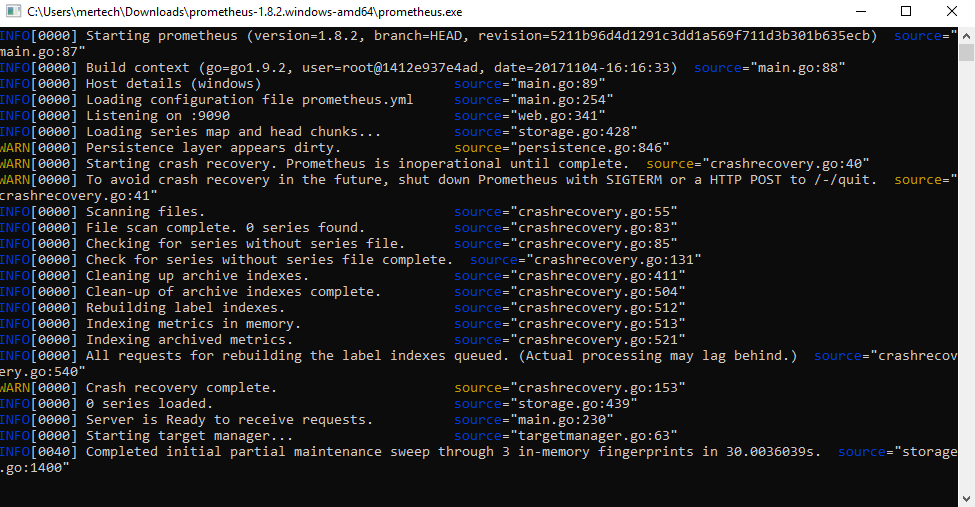
Minimize but do not close the prometheus.exe window. Then, open your web browser and navigate to localhost:9090.
From localhost:9090, you can view your API’s performance data. We’ve created a number of Thriftly-specific key performance metrics, including:
thriftly_dispatch_call_latencies_seconds_total: Measures the average latency between requests and responses. Ideally, the latency between requests and responses should be as close to zero as possible, indicating that calls are spending little time queued. If latency increases to an abnormal level, your server load might be too high.
thriftly_dispatch_executing_requests: Measures the number of requests your API is currently processing. This metric’s maximum value is determined by the number of application pools you’ve assigned to your API(s). If this metric hits its maximum value often, you may want to create additional application pools.
thriftly_dispatch_exited_workers_total: This metric measures the total number of exited workers.
thriftly_dispatch_idle_workers: This metric measures the total number of idle workers.
thriftly_dispatch_pending_requests: This metric measures the total number of requests pending.
thriftly_dispatch_running_workers: This metric measures the total number of currently running workers.
thriftly_dispatch_started_workers_total: This metric measures the total number of started workers.
thriftly_runtime_call_duration_seconds_total: This metric measures the amount of time your API takes to send a response after receiving a request.
thriftly_runtime_calls_total: This metric measures the total number of calls made to your API.
thriftly_runtime_request_bytes_total: This metric measures the amount of data sent to your API per call. For HTTP-based calls, this metric does not include the size of the headers or URL request included in the calls.
thriftly_runtime_response_bytes_total: This metric measures the amount of data your API has sent back in responses, per call. For HTTP-based calls, this metric does not include the size of headers included in the calls.
As an example, let’s walk through gathering data on and analyzing the thriftly_runtime_request_bytes_total metric.
If you haven’t already, run your Thriftly application from the Thriftly Configurator. (If you need a refresher on how to do so, refer to the Running Your Application and Viewing Your Endpoints on the Web section.)
From the Thriftly Configurator, select the endpoint for which you’d like to view performance data. Then, select the Endpoint Info button.
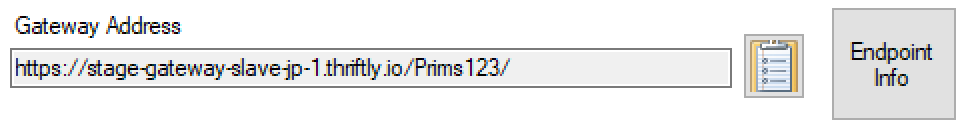
Your API’s endpoint URL appears in your web browser. Select the Test API link for one of your APIs, and then perform a series of calls to that API.
Navigate back to the tab or window in which you opened Prometheus (by opening localhost:9090).
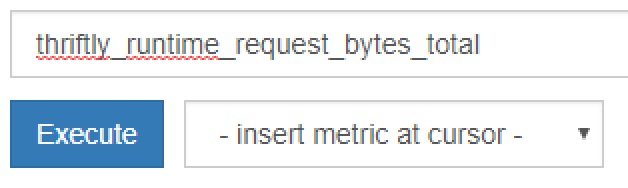
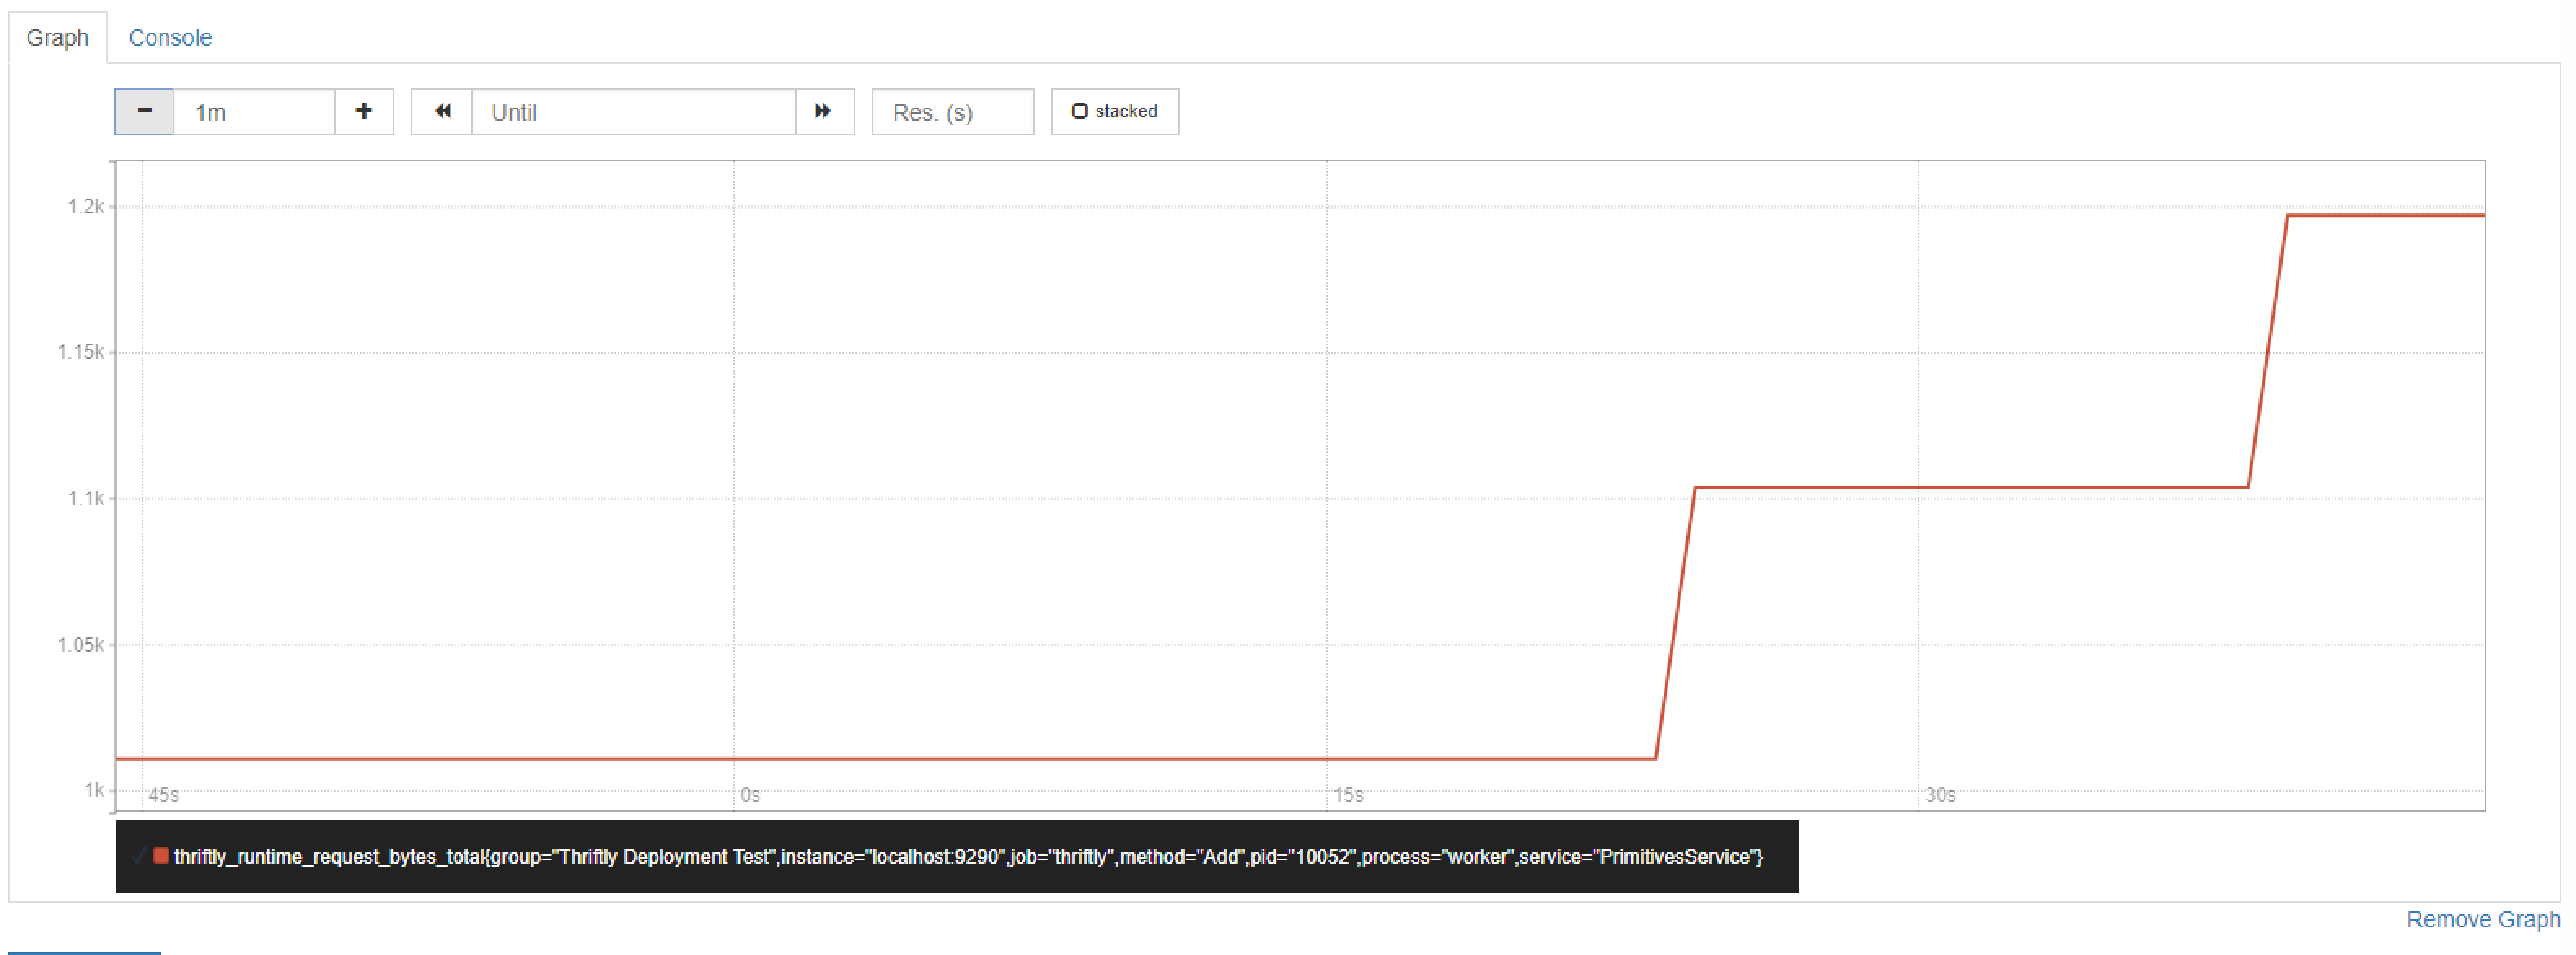
In the Expression field, search for and select the thriftly_runtime_request_bytes_total metric. Then, select the Execute button.
Select the Graph tab. You should see a graph showing the bytes of data requested from your API over time. Additionally, if you hover your mouse over the trend line, you can see more data about this metric.
That’s only a basic walkthrough of just one performance metric you can track using Prometheus. For a full overview of how to perform in-depth metric queries using Prometheus, refer to Prometheus’s own documentation on querying.
If you’re looking to analyze your data more closely or set up automatic email alerts, you should connect Prometheus to Grafana as detailed in the next section, Creating Metrics Dashboards in Grafana.