Troubleshooting
BTR2SQL allows you to generate two types of reports to trace errors that can occur during the migration process. The migration report is a comprehensive report summary that you can use to determine whether or not the migration was successful. If any inconsistency is encountered, the report displays where the error occurred.
Another method of reporting that BTR2SQL uses is a low-level driver trace that you can enable by setting either environment variables or registry values.
External tools can also be downloaded to assist in troubleshooting.
Migration Report
The Migration Report is a summary report that displays any errors that may have occurred during the last migration, the license and version of the migration tool, a table creation report, an index creation report, and a data migration report. You can generate multiple migration reports in one file for viewing multiple migration reports and then clear the report to start a new migration report (see Setting Migration Preferences).
At the top of the report, the file displays the driver version and the license number. Next, the file displays the date and time the report was generated and the user name of the user who generated the report. A sample migration report is shown in Figure 27.
Select Report | Migration Report.
==============================================================================
Mertech Data Systems, Inc
Database Migration Report
Btr2SQL 7.0.10579.0

Licensed to: Evaluation License
------------------------------------------------------------------------------

Report Generated on: 12/18/2025
At: 10:24:30 AM
By: sa
For Server: GATEWAY\sqlexpress Database/Tablespace: tempdb
DDF Location: C:\ProgramData\Pervasive Software\PSQL\Demodata
------------------------------------------------------------------------------
REPORT SUMMARY

Errors: No errors

No Errors in Table Creation
No Errors in Index Creation
No Errors in Data Migration
                                       TABLE CREATION REPORT

------------------------------------------------------------------------------

Table Name   Status             Error Log

------------------------------------------------------------------------------

CLASS        * * CREATED * *

                                        INDEX CREATION REPORT

------------------------------------------------------------------------------

Table Name    Index No.                Status             Error Log

------------------------------------------------------------------------------

CLASS         Index.1                  * * CREATED * *

              Index.2                  * * CREATED * *

                                        DATA MIGRATION REPORT

------------------------------------------------------------------------------

Table Name  Total Records  Records Migrated   Status     Remark

------------------------------------------------------------------------------

Class                 211               211   * * PASS * *

---------------------------------- END MIGRATION -----------------------------
==============================================================================
Figure 27 Sample Migration Report
Migration Driver Trace
If you are receiving an error during migration, you may need more details than the summary report provides. Enabling the driver trace during migration can identify which row failed and the values of the fields. This report is enabled in the Preferences dialog box (see Setting Migration Preferences).
Select Report | Driver Trace.
11:49:59.900> BTR2SQL 7.0.10675.0 SQL_BTR.dll [10000000] (C:\Program
              Files\Mertech Data Systems\DB Drivers\Btrieve\bin\sql_btr.dll)
11:49:59.900> Computer : GATEWAY
11:49:59.900> ModuleName : C:\Program Files\Mertech Data Systems\DB
              Drivers\Btrieve\bin\Btr2SQL.exe
11:49:59.900> Process # 280 WTS # 0
11:49:59.916> Trace Level: 1 flush: no buffers: 'sql pb kb db '
11:49:59.916> Date: Tue Dec 18 11:49:59 2012
11:49:59.947> Btrieve: 10.30 NT Server Engine
11:49:59.947> Active Code Page: 1252 (1252 (ANSI - Latin I))
11:49:59.947> Active OEM Code Page: 437 (437 (OEM - United States))
|-----------------------------------------------------------------------------------------|

11:50:13.431> Performance: 13.48748 gap in trace
11:50:13.431> btr2sql.exe: Converting Class
|-----------------------------------------------------------------------------------------|

11:50:13.478> btr2sql.exe: Enabling SnapShot Isolation on Database . . .
11:50:13.478> PrepareBuffer: /*EOVDV#F@PB@@WF"uanref#QDP#CMHLU^WMCQWKMU[JQNHBVHKM"NJ
              ___________________________ mc*/

11:50:13.525> Execute query time: 0.04576
11:50:13.525> PrepareBuffer: /*EOVDV#F@PB@@WF"uanref#QDP#PDEG]BKNOHPWGE[PL@TPJNP#MO
              ____________________________mc*/

11:50:13.759> Execute query time: 0.23281
11:50:13.759> OLE-DB ERROR: Execute failed:
11:50:13.759> HRESULT: 0X80040E14, SQLSTATE: 42000, Native Code: 5058 : Option
              'READ_COMMITTED_SNAPSHOT' cannot be set in database 'tempdb'.

11:50:13.759> MSSQL ERROR: Execute failed: Errors in SQL command: 5058 : Option
              'READ_COMMITTED_SNAPSHOT' cannot be set in database 'tempdb'.

11:50:13.759> MDS ERROR: #25000: 'Execute failed: Errors in SQL command: 5058 : Option
              'READ_COMMITTED_SNAPSHOT' cannot be set in database 'tempdb'.'

11:50:15.369> Performance: 1.60708 gap in trace
11:50:15.369> PrepareBuffer: /*<"<$@CMH#qq[wcchfq!,<.>(/.1-#*/
11:50:15.431> Performance: Prepare ran long: 0.06619
11:50:15.603> Execute query time: 0.16406
11:50:15.603> Read 1 rows
11:50:17.681> Performance: 2.07310 gap in trace
11:50:17.681> Status 12 opening Btrieve file 'C:\ProgramData\Pervasive
              Software\PSQL\Demodata\fieldext.ddf'

11:50:17.681> Field 1 ID               type=15  ofs=0   size=4  flags=0
11:50:17.681> Field 2 Name             type=0   ofs=4   size=7  flags=1
11:50:17.681> Field 3 Section          type=0   ofs=11  size=3  flags=1
11:50:17.681> Field 4 Max_Size_nis
11:50:17.681> Field 5 Max_Size         type=14  ofs=15  size=2  flags=4
11:50:17.681> Field 6 Start_Date       type=3   ofs=17  size=4  flags=0
11:50:17.681> Field 7 Start_Time       type=4   ofs=21  size=4  flags=0
11:50:17.681> Field 8 Finish_Time      type=4   ofs=25  size=4  flags=0
11:50:17.681> Field 9 Building_Name    type=0   ofs=29  size=25 flags=1
11:50:17.681> Field 10 Room_Number     type=14  ofs=54  size=4  flags=0
11:50:17.681> Field 11 Faculty_ID      type=14  ofs=58  size=8  flags=0
11:50:17.744> RecordSize: 66 flags: 512
11:50:17.744> Index 1.1 ID flags=258
11:50:17.744> Index 2.1 NAME flags=1298
11:50:17.744> Index 2.2 SECTION flags=1282
11:50:17.744> Index 3.1 FACULTY_ID flags=278
11:50:17.744> Index 3.2 START_DATE flags=274
11:50:17.744> Index 3.3 START_TIME flags=258
11:50:20.384> Performance: 2.63401 gap in trace
11:50:20.384> Creating new table (CLASS) at 'C:\ProgramData\Pervasive
              Software\PSQL\Demodata\CLASS.MKD'

11:50:20.384> RecSize=66 (fixed length)   11 fields, 3 indexes.
11:50:20.431> Transaction Started  iso level=READ COMMITTED
Figure 28 Sample Migration Driver Trace
Runtime Driver Trace
The Runtime Trace file is generated while your application is running. Each Btrieve function call made is logged. The Runtime Trace file is enabled in the Preferences dialog box (see Setting Migration Preferences).
NOTE: It is important to note that you should turn this option on only when trying to debug the calls and data being sent and received from the server. For normal operation, remember to turn this off otherwise you will experience performance degradation.
Two variables control the trace output. TRACE_ON defines the location of the trace file — full (or relative) path and filename. TRACE_LEVEL sets the amount of output — depending on the amount of detail needed.
1: ERROR_LEVEL Only messages generated because of an error situation. Messages in trace are preceded by “ERROR:” or “WARNING:”
0: BASIC_LEVEL Basic output - flow of application. Showing begin/end transactions, locks gained/released, record reads
1: DETAIL_LEVEL1 Field values in record read/written - Btrieve input/output buffers
2: DETAIL_LEVEL2 The “debug” level - it fills in more details above level 1 in order to track down a problem
3: DETAIL_LEVEL3 Needed only in rare cases
Each TRACE_LEVEL includes details from all previous levels.
NOTE: In the event that you are receiving an error from the server and the nature of the problem is unclear, Mertech recommends you run this trace first and then contact Mertech Technical Support. For any error on the server, you should first look in the server documentation for clarification before contacting Mertech.
09:05:23.893> PGSBTR 7.0.10755.1    W3BTRV7.dll   [10000000] (C:\MovieRental-POC\app\w3btrv7.dll)
09:05:23.893> Date: Tue Mar 10 09:05:23 2026
09:05:23.893> Process # 10000   WTS # 0   C:\MovieRental-POC\app\MovieRental-w3b7.exe
09:05:23.893> Computer: OLIVERNELSO29BB
09:05:23.893> cwd='C:\MovieRental-POC\app'
09:05:23.893> Commandline: MovieRental-w3b7.exe
09:05:23.893> Trace Level: 3    flush: no    buffers: 'sql kb db fb'    lobs: -3    getnext: -3
09:05:23.893> NOTE: Trace Levels higher than level 2 are for advanced troubleshooting and should only be used upon request from Mertech Tech Support.
09:05:23.894> Active Code Page: 1252 (1252  (ANSI - Latin I))
09:05:23.894> Active OEM Code Page: 437 (437   (OEM - United States))
09:05:23.894> C Runtime 14.39.33519.0
09:05:23.895>
09:05:23.895> Global INI file: C:\MovieRental-POC\app\MDS_GLOBAL.INI
09:05:23.895>         Trace: Level=3, Location='C:\Temp\pgs_btr.log',
09:05:23.895>         Identifier Case: 2,
09:05:23.895>         Space Char as Filename Terminator: 0, Connection Recovery: 0,
09:05:23.895>
09:05:23.895> Global INI file: C:\MovieRental-POC\app\MDS_GLOBAL.INI
09:05:23.895> Current Driver Settings:
09:05:23.895>         Trace: Level=3; Flush=no, Buffers='sql kb db fb', Location='C:\Temp\pgs_btr.log', LOBs=-3, GetNext=-3, BOPens='(null)'
09:05:23.895>         PerformanceGap: 0.800,  QueryThreshold: off,  ReportQueryTimes: no,  PerformanceReport: ''
09:05:23.895>         ServerSideLocking: yes,  SQLLocks: no,  UseFastStat: no,  AllowAssertDialog: yes
09:05:23.895>         UseGetEqualCache: no,  IdentifierCase: 2, ConnectionRecovery: no, Use Estimate Row Count: no, Substitute for Invalid Values: yes,  Treat Invalid Values as Errors: no
09:05:23.895>         SpaceCharAsFilenameTerminator: no, EpochYear: -1
09:05:23.895>         Btrieve Version reported: 7.94
09:05:23.895>         ApplicationName: MOVIE_RENTAL
09:05:23.895>
09:05:23.895> New context in W3BTRV7.dll: 2710.444D.4143      1 active
|-----------------------------------------------------------------------------------------|
#1
09:05:23.895> Extended Btrieve Function Call: B_EXTENDED_VERSION KeyNum: 1 DataLen: 270 KeyLen: 0 ClntID: 2710.444D.4143
09:05:23.895> <IN> DB: 433A5C4D...92ED8E7658FC1A00B94F<<<
09:05:23.896> ReturnCode : 0   DataLen: 270
09:05:23.896> <OUT> DB: 032A0700...92ED8E7658FC1A00B94F<<<
|-----------------------------------------------------------------------------------------|
#2
09:05:23.896> Extended Btrieve Function Call: B_EXTENDED_VERSION KeyNum: 1 DataLen: 270 KeyLen: 0 ClntID: 2710.444D.4143
09:05:23.896> <IN> DB: 0000000000...20FC1A00000000007789<<<
09:05:23.896> ReturnCode : 0   DataLen: 270
09:05:23.896> <OUT> DB: 032A0700...20FC1A00000000007789<<<
|-----------------------------------------------------------------------------------------|
#3
09:05:23.896> Extended Btrieve Function Call: B_IS_MIGRATED KeyNum: 0 KeyLen: 18 ClntID: 2710.444D.4143
09:05:23.896> <IN> KB: 2E2E5C646174615C53544F5245532E4D4B44<<<
09:05:23.896> B_IS_MIGRATED: Filename: ..\data\STORES.MKD
09:05:23.896> ReturnCode : 0   DataLen: 0
09:05:23.896> <OUT> KB: 2E2E5C646174615C53544F5245532E4D4B44<<<
|-----------------------------------------------------------------------------------------|
#4
09:05:23.896> BtrieveFunctionCall: B_VERSION KeyNum: 0 DataLen: 5 ClntID: 2710.444D.4143
09:05:23.896> <IN> DB: 12000000A8<<<
09:05:23.896> ReturnCode : 0   DataLen: 5
09:05:23.896> <OUT> DB: 07005E0054<<<
|-----------------------------------------------------------------------------------------|
#5
09:05:23.896> Extended Btrieve Function Call: B_EXTENDED_VERSION KeyNum: 1 DataLen: 270 KeyLen: 0 ClntID: 2710.444D.4143
09:05:23.896> <IN> DB: F0D08302...000083020000<<<
09:05:23.896> ReturnCode : 0   DataLen: 270
09:05:23.896> <OUT> DB: 032A0700...000083020000<<<
|-----------------------------------------------------------------------------------------|
Figure 29 Sample Runtime Driver Trace
Turning on application logging
There are several ways to turn on application logging:
Tracing driver calls using the Mertech Trace Utility
The easiest method of enabling a trace is to use the Mertech Trace Utility, which is installed with BTR2SQL and available from the Windows Start menu under Mertech Data Systems.
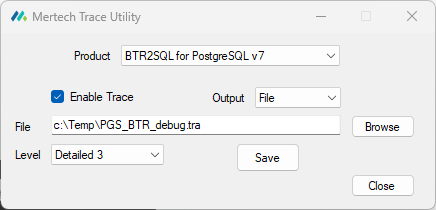
The utility provides the following controls:
Product — Select which Mertech driver product to configure. The dropdown lists all installed Mertech products (e.g., BTR2SQL for PostgreSQL v7, BTR2SQL for SQL Server v7, BTR2SQL for Oracle v7). The trace settings are stored per product.
Enable Trace — Check this box to turn tracing on. Uncheck it to disable tracing. When unchecked, the remaining fields are ignored.
Output — Choose where trace output is sent. File writes the trace to the path specified in the File field. Debug sends the trace output to the Windows debug output channel, which can be viewed with tools such as DebugView from Sysinternals.
File / Browse — The full path and filename for the trace output file (e.g.,
c:\Temp\PGS_BTR_debug.tra). Use the Browse button to select a location. Only applicable when Output is set to File.Level — Controls the verbosity of the trace output. The available levels and their numeric equivalents are:
Errors Only (level -3) — Captures only error and warning messages. Look for lines preceded by
ERROR:orWARNING:in the output.Debug (level 0) — Shows the overall flow of your application’s database activity: transactions starting and ending, locks acquired and released, and records being read.
Detailed 1 (level 1) — Adds field values for records being read and written, along with Btrieve input and output buffers.
Detailed 2 (level 2) — The recommended level for active troubleshooting. Includes additional context beyond Detailed 1 to help isolate a specific problem.
Detailed 3 (level 3) — Maximum verbosity, including field values during inserts and index operations. This level generates very large trace files and may noticeably affect performance — use it only when requested by Mertech Technical Support.
Click Save to apply the settings. The trace takes effect the next time the driver is loaded (i.e., the next time your application starts or opens a Btrieve file). Click Close to exit the utility.
Note
The Trace Utility writes its settings to the mds_global.ini file. The same trace settings can also be configured by editing that file directly, by setting environment variables, or through registry keys as described below.
Tracing driver calls with environment variables
SET btr2sql_TRACE_ON=<TracefileName>

SET btr2sql_TRACE_LEVEL=<level>
NOTE: There are no spaces after the equals sign.
The environment variables must be active in the system before starting the application. You can add these two variables using the My Computer properties (Advanced tab, Environment Variables button). Or you can do this at a Command Prompt before starting the application.

Figure 30 Setting up a trace file at the command prompt
Tracing driver calls with registry settings
HKEY_CURRENT_USER\SOFTWARE\Mertech Data Systems\DB Drivers\BTR\\\ *driver*\\v5
where driver is one of Oracle Driver, SQL Server Driver, or PgSQL Driver
Add the string value TRACE_ON and set its value to the name of the trace file. Add another string value named TRACE_LEVEL with a number between -1 and 3. If the registry keys do not exist, you will need to create each key in the hierarchy before entering the values.

Figure 31 Setting up a trace file using the registry
NOTE: Settings can also be stored under HKEY_LOCAL_MACHINE
Tracing driver calls with mds_global.ini settings
The mds_global.ini file provides a persistent way to configure tracing. The key settings are:
TRACE_ON — specifies the trace file path
TRACE_LEVEL — controls the verbosity of trace output
TRACE_FLUSH — determines whether trace data is flushed immediately
For a complete list of trace-related settings, see Trace Settings.
Tip
For recommended production tracing settings using circular logging, see Production Tracing Configuration in the Deploying Your Application section.
Tracing driver calls using MdsSetSetting
You can enable or modify tracing at runtime by calling MdsSetSetting from your application code. This allows you to start or stop tracing without restarting the application.
// Enable tracing programmatically
MdsSetSetting(NULL, "TRACE_ON", "c:\\trace\\sql_btr.tra");
MdsSetSetting(NULL, "TRACE_LEVEL", "2");
Important
If you enable TRACE_ON via MdsSetSetting, make it the last trace setting you update. If a trace is already active, it will be stopped and a new file will take over using the latest trace settings.
For more details, see Setting global and folder specific values programmatically.
Startup Trace
There is a startup trace file to record errors detected during the early stages of driver initialization (i.e., before the regular trace begins). The startup trace is automatically turned on and then turned off after successful driver connection.
The startup trace file is named “mds_<drivername>.log” (for example, mds_ora_btr.log, mds_sql_btr.log, mds_pgs_btr.log) and is always written to %temp%.
NOTE: Always use Windows Start | Run “%temp%” to navigate to the temp folder rather than manually going to what you think is the temp folder.
The startup trace logs only errors and only during the driver’s initial phase. The startup trace file is good place to look if, for example, your user-defined trace file is not created. An entry may be recorded in the startup trace file indicating that the user-defined trace file cannot be opened.
External Tools
Errors are often caused because a driver dependency is not installed or not available on the Windows PATH. Dependency Walker and Process Monitor are two good tools that you can use to identify a missing dependency for the BTR2SQL Migration Utility or your application and to troubleshoot runtime errors.
Dependency Walker
Download Dependency Walker from www.dependencywalker.com. Mertech driver and the Migration Utility are 32-bit, make sure to download the 32-bit version of Dependency Walker.
Open the downloaded ZIP file.
Create an extract folder and extract all the files.
(Optional) drag a shortcut to your desktop or quick launch toolbar.
Identifying statically loaded dll dependencies
Start Dependency Walker.
Choose File | Open from the menu bar and browse to the location of the Mertech driver dll. Mertech driver dlls are usually located at
<Program Files>\Mertech Data Systems\DB Drivers\Btrieve\binChoose sql_btr.dll for MS SQL, ora_btr.dll for Oracle or pgs_btr.dll for PostgreSQL.
Missing or mismatched dependencies appear in yellow or red. The most common dll to be missing is oci.dll.
Examining your application at runtime
Start Dependency Walker and set the View | Full Paths option.
Select the application using the File | Open command. The application is scanned for dependencies and a hierarchical diagram of all dependent modules is displayed in the Module Dependency Tree View.
Select Profile | Start Profiling.
Make sure Use full paths when logging file names is checked.
Click OK.
Your application should begin to run. As your application runs, Dependency Walker logs information to the Log View and updates the tree and list views.
Process Monitor
Process Monitor can also be used to identify missing dependencies and to troubleshoot other runtime errors.
Download Process Monitor from https://technet.microsoft.com/en-us/sysinternals/processmonitor.
Open the downloaded ZIP file.
Create an extract folder and extract all the files.
(Optional) drag a shortcut to your desktop or quick launch toolbar.
Start Process Monitor.
Select File from the menu bar and make sure Capture Events IS NOT checked.
Select Edit | Clear Display.
Select Filter and add Process Name btr2sql.exe to the list of events to be captured.

Enable event capture: select File from the menu bar and select Capture Events so IT IS checked.
Start the Btr2SQL Migration Utility or your application and reproduce the error.
Disable event capture in the Process Monitor: select File from the menu bar and select Capture Events so it IS NOT checked.
Examine the output. NAME NOT FOUND in the Result column can point to a missing dependencies.
Utilizing Function Executor
Whatever language your application is written in and whether it utilizes a high-level COM object, a class wrapper, or the BTRV function directly, each operation eventually is funneled into the BTRCALL (or BTRCALLID) function exported from w3btrv7.dll or wbtrv32.dll.
Pervasive provides a low-level tool for executing Btrieve commands called Function Executor. Since the tool runs directly off of w3btrv7.dll calling the standard BTRCALLID function, it is a good troubleshooting tool when an application is receiving an unexpected error or you would like to experiment with a particular scenario.
A simple technique to discern the difference between Btrieve and SQL behavior is to create two folders. In one, place wbexec32.exe (from pvsw\bin) and the original w3btrv7.dll. In the second folder, place another copy of the wbexec32 along with the Mertech w3btrv.dll and sql_btr.cfg, ora_btr.cfg, or pgs_btr.cfg. Then create shortcuts to each of these and you can selectively execute Btrieve API calls against Btrieve and against SQL.
NOTE: Function Executor is just like any Btrieve application and will thus require the SQL client to be installed and on the system PATH (see Prerequisites).
Using the Function Executor History window, you can save a sequence of API calls and then play them back later or ask it to repeat them any number of times. During playback, there is a small arrow in the lower right of the dialog box which will access a record of time to execute the calls. This can be used for quick performance comparisons.
Blog Topics
The Mertech Data Website contains white papers and blogs to assist with additional troubleshooting topics. The site search option  can help you to find the required topics.